
Pro basketball’s 30 franchises are all soaring high above the rim—worth $5.4 billion on average, thanks to record sales of the Lakers and Celtics—but no one is scoring quite like one $11 billion team.
Private equity billionaire Mark Walter’s agreement in June to buy the Los Angeles Lakers at a $10 billion valuation, currently awaiting approval by the NBA, is set to establish a record sale price for a control stake in any sports team. Yet for all the attention the deal has attracted, the Lakers are not even the most valuable team in their league.
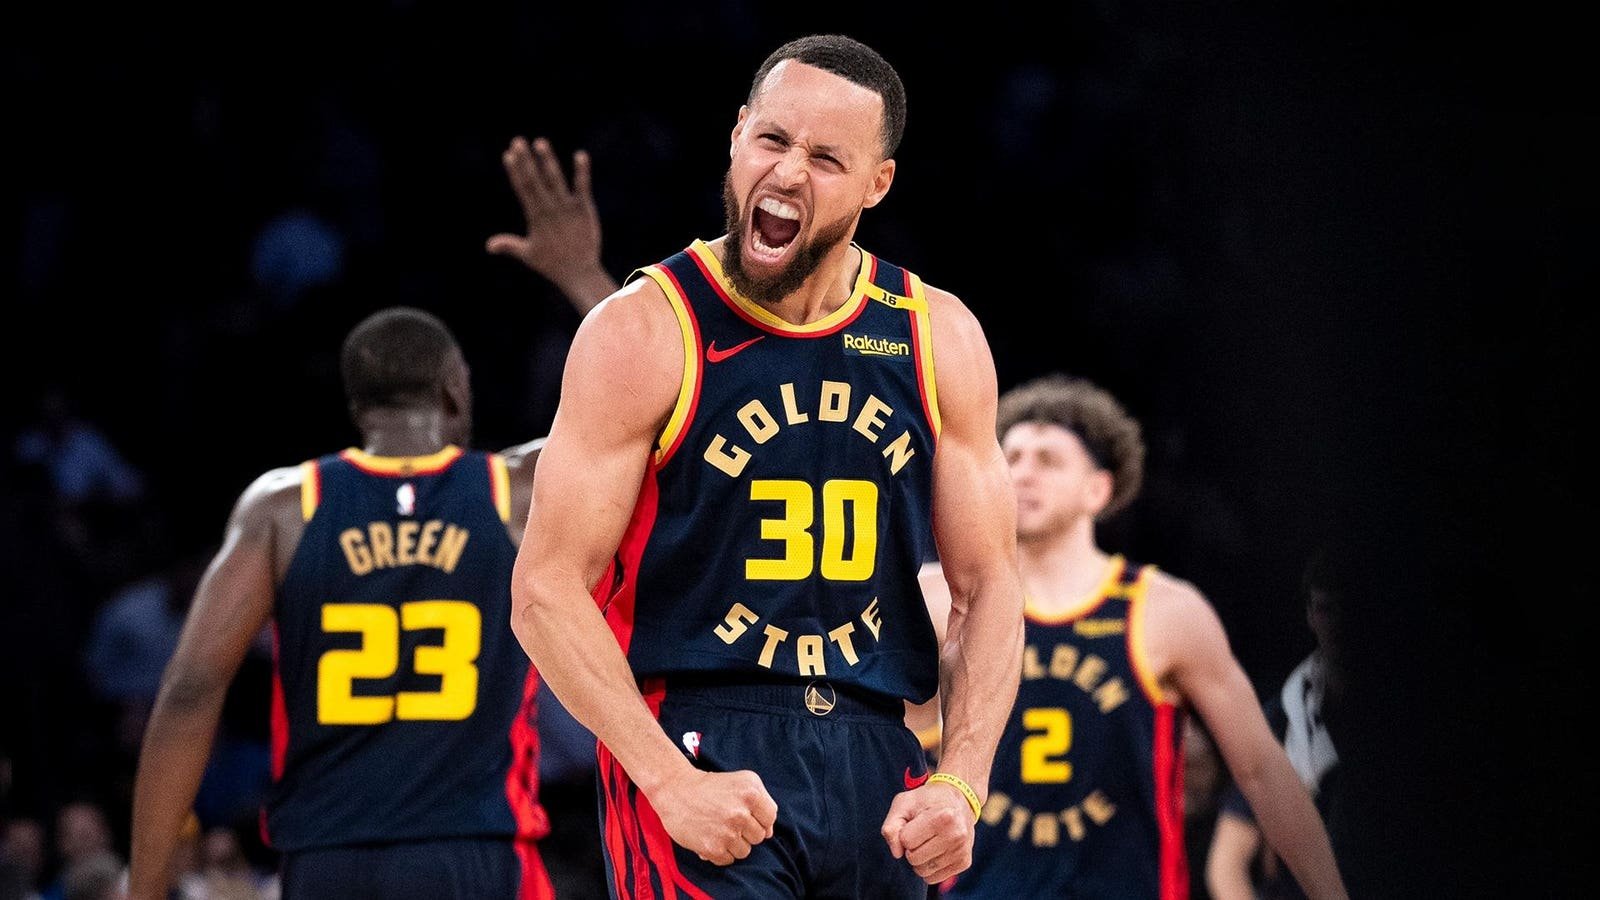
For the fourth year in a row, that honor belongs to the Golden State Warriors, who Forbes estimates could fetch $11 billion if owners Joe Lacob and Peter Guber were willing to part with them.
No other NBA team was within $300 million of the Warriors’ estimated $880 million in revenue last season, with the club far outpacing the rest of the league with its income from sponsorships and premium seating and ranking in the top three in virtually every category tracked by Forbes. In fact, Golden State more than doubled the $417 million league average for total revenue, and compared with the other North American sports leagues, the Warriors surpassed every franchise except the NFL’s Dallas Cowboys, who topped $1.2 billion in 2024 revenue.
Despite that financial muscle, not all NBA insiders agree that the Warriors should sit above the Lakers in the ranking of the league’s most valuable teams—or, for that matter, above the New York Knicks, who land at No. 3 on Forbes’ 2025 list at $9.75 billion. Then again, not everyone believes the Lakers are actually worth the $10 billion that Walter, who is also the controlling owner of MLB’s Los Angeles Dodgers, was willing to pay. Some bankers, for instance, suggest the club’s true value might be better captured with a blended valuation—perhaps between $8 billion and $9 billion—that reflects both this year’s purchase and Walter’s initial 2021 deal for a minority stake in the franchise.
The relative muddle at the top of the hierarchy stems in part from the fact that the Lakers’ and the Knicks’ valuations aren’t entirely grounded in the franchises’ ability to generate cash. Rather, they hinge on the teams’ appealing home markets, storied history and global brand recognition, as well as their scarcity. In many cases, it takes decades for such a marquee asset to come up for sale.
So while Forbes’ $11 billion valuation of the Warriors comes in at a robust 12.5 times their estimated 2024-25 revenue, the equivalent figure for the Lakers is 18.1—in the words of one league insider, more like an “old-school software multiple” than a number typically associated with a sports team in a nearly 80-year-old league. The Knicks, meanwhile, are valued at 18.3 times their estimated 2024-25 revenue.
Those multiples are such outliers that they may not have much to say about the economics of pro basketball more generally. But even for the rest of the NBA, business these days is very, very good.
According to Forbes estimates, league-wide revenue last season was up 10% year-over-year, to roughly $12.5 billion, including money from non-NBA events held at teams’ arenas but netting out arena debt service. Another significant jump is coming in 2025-26—the first season of the 11-year, $76 billion national media package the NBA signed last year with Disney, NBCUniversal and Amazon Prime Video. On average, the broadcast deals will pay roughly $4 billion more annually than the league’s previous agreements.
With all of that cash pouring in, Forbes estimates that the 30 NBA teams are worth $5.4 billion on average—or just over $160 billion collectively—representing an increase of 21% over last year and more than doubling the average of $2.5 billion from just four seasons ago. The league’s floor is also up 17%, with the Memphis Grizzlies rising to $3.5 billion, from $3 billion in 2024.
Two recent transactions give credence to those sky-high numbers. In August, a group led by private equity billionaire Bill Chisholm took control of the Boston Celtics in a deal that, blending the price paid for the tranche that traded this year and a step-up for the remaining equity that will change hands by 2028, values the team at roughly $6.7 billion, or 14.6 times last season’s estimated revenue. The same month, Tom Dundon, the owner of the NHL’s Carolina Hurricanes, agreed to buy the Portland Trail Blazers—a team that league insiders unanimously rank in the bottom third of the NBA—at a valuation of around $4.25 billion, or 11.8 times last season’s estimated revenue.
Forbes now pegs the average revenue multiple across the NBA at 12.9x, up from 11.7x last season and 7.3x in 2019-20, which was Forbes’ last NBA list before the Covid-19 pandemic. The comparable current figures are 10.7x for the NFL, 9.3x for MLS, 8.5x for the NHL and 6.4x for MLB—a disparity that signals investors’ appetite to break into basketball.
The steady rise in the NBA’s multiples was driven in part by anticipation for the league’s new national media package, and now that there is no single business-altering event on the immediate horizon, investors might reasonably start paying less of a premium as the incremental revenue kicks in. Yet league insiders almost universally say that the NBA ownership waiting list is so long that multiples are likely to stay elevated, at least in the near term.
There is less consensus as to whether the rise in revenue can keep up, and how, but there are reasons for optimism. For instance, the NBA has seen strong partnership growth—climbing 91% over the past five seasons at the team level, according to research firm SponsorUnited—and while that trajectory is sure to flatten now that jersey patch sponsorships have caught on across the sport, the league has renewed some of its deals at significantly higher rates and is enticing brands in new categories and geographic markets.
Even more alluring for potential investors is the NBA’s pipeline of new arenas and renovations. The Oklahoma City Thunder, for example, are in line to receive $850 million in public money toward construction costs. Meanwhile, voters in Texas’ Bexar County are set to decide the fate of up to $311 million in funding toward an arena to replace the San Antonio Spurs’ Frost Bank Center, on top of $489 million the city has already committed, and the Philadelphia 76ers and the Dallas Mavericks are also pursuing new homes.
For team owners, the benefits of a new building are difficult to overstate, as evidenced by the Los Angeles Clippers, who opened the Intuit Dome in 2024 after spending 25 years as a tenant at what is now called Crypto.com Arena. With the improved sponsorship and premium seating offerings, the move boosted the club’s revenue 61% year-over-year, according to Forbes estimates, and sent the Clippers’ valuation soaring 36% to $7.5 billion despite an ongoing scandal around a now-bankrupt team sponsor, Aspiration.
The other big business opportunity is overseas, where the NBA holds a sizable lead on the other North American pro leagues in terms of cultivating an international fan base. How quickly and effectively the NBA can monetize those eyeballs isn’t yet clear, but insiders believe its efforts to launch a European league as soon as 2027 could yield returns sooner than some expect, through expansion fees charged to new ownership groups.
There will, of course, be hurdles to clear both abroad and domestically—such as the nationwide turbulence with regional sports networks, draining one important local revenue source for certain teams—and there won’t be another $76 billion TV package coming along to smooth over the bumps. But nothing, it seems, can quench the thirst of investors eager to join the ranks of NBA owners.
“With leagues like the NBA where they control content and control IP, there are just things that will monetize that we don’t even know about yet,” notes one league insider. “A few years ago, they were getting no fees for data rights—what are they getting now? So there’s going to be a lot of these different things that you and I probably don’t even see right now that will influence valuations.”
2025 NBA TEAM VALUES
#1. $11 billion
One-Year Change: 25% | Revenue: $880 million | Operating Income: $409 million | Owners: Joe Lacob, Peter Guber
Brandon Dill/Associated Press
#2. $10 billion
One-Year Change: 41% | Revenue: $551 million | Operating Income: $170 million | Owners: Jerry Buss Family Trusts, Mark Walter, Todd Boehly
Nate Billings/Associated Press
#3. $9.75 billion
One-Year Change: 30% | Revenue: $532 million | Operating Income: $98 million | Owner: Madison Square Garden Sports
#4. $7.5 billion
One-Year Change: 36% | Revenue: $569 million | Operating Income: $154 million | Owner: Steve Ballmer
#5. $6.7 billion
One-Year Change: 12% | Revenue: $458 million | Operating Income: $116 million | Owners: Bill Chisholm, Grousbeck family
#6. $6 billion
One-Year Change: 20% | Revenue: $434 million | Operating Income: $160 million | Owner: Jerry Reinsdorf
#7. $5.9 billion
One-Year Change: 20% | Revenue: $467 million | Operating Income: $191 million | Owner: Tilman Fertitta
Ashley Landis/Associated Press
#8. $5.7 billion
One-Year Change: 34% | Revenue: $417 million | Operating Income: $110 million | Owner: Micky Arison
#9. $5.6 billion
One-Year Change: 17% | Revenue: $402 million | Operating Income: $50 million | Owners: Joseph Tsai, Koch family
#10. $5.45 billion
One-Year Change: 18% | Revenue: $472 million | Operating Income: $204 million | Owners: Josh Harris, David Blitzer
Matt Slocum/Associated Press
#11. $5.425 billion
One-Year Change: 26% | Revenue: $455 million | Operating Loss: $33 million | Owners: Mat Ishbia, Justin Ishbia
#12. $5.4 billion
One-Year Change: 23% | Revenue: $380 million | Operating Income: $136 million | Owners: Rogers Communications, Larry Tanenbaum
#13. $5.1 billion
One-Year Change: 9% | Revenue: $407 million | Operating Income: $87 million | Owners: Adelson family, Mark Cuban
#14. $5 billion
One-Year Change: 32% | Revenue: $477 million | Operating Income: $203 million | Owner: Tony Ressler
Kevin C. Cox/Getty Images
#15. $4.8 billion
One-Year Change: 22% | Revenue: $440 million | Operating Income: $127 million | Owner: Dan Gilbert
#16. $4.7 billion
One-Year Change: 15% | Revenue: $389 million | Operating Income: $135 million | Owner: Ted Leonsis
#17. $4.6 billion
One-Year Change: 18% | Revenue: $364 million | Operating Income: $67 million | Owner: E. Stanley Kroenke
Etienne Laurent/Associated Press
#18. $4.45 billion
One-Year Change: 20% | Revenue: $354 million | Operating Income: $76 million | Owner: Vivek Ranadivé
#19. $4.4 billion
One-Year Change: 14% | Revenue: $401 million | Operating Income: $151 million | Owners: Peter J. Holt, Sixth Street
#20. $4.35 billion
One-Year Change: 19% | Revenue: $357 million | Operating Income: $114 million | Owners: Clayton Bennett, George Kaiser, Aubrey McClendon estate
Nate Billings/Associated Press
#21. $4.3 billion
One-Year Change: 8% | Revenue: $355 million | Operating Income: $26 million | Owners: Wes Edens, Jimmy and Dee Haslam
#22. $4.25 billion
One-Year Change: 21% | Revenue: $361 million | Operating Income: $111 million | Owner: Paul G. Allen Trust
#23. $4.2 billion
One-Year Change: 17% | Revenue: $342 million | Operating Income: $89 million | Owners: Herb Simon, Stephen Simon
Jason Miller/Getty Images
#24. $4.1 billion
One-Year Change: 15% | Revenue: $340 million | Operating Income: $103 million | Owners: Ryan and Ashley Smith
#25. $3.9 billion
One-Year Change: 22% | Revenue: $318 million | Operating Income: $94 million | Owner: DeVos family
#26. $3.8 billion
One-Year Change: 15% | Revenue: $328 million | Operating Income: $82 million | Owners: Rick Schnall, Gabe Plotkin, Chris Shumway
#27. $3.65 billion
One-Year Change: 7% | Revenue: $321 million | Operating Income: $106 million | Owner: Tom Gores
Marta Lavandier/Associated Press
#28. $3.6 billion
One-Year Change: 16% | Revenue: $320 million | Operating Loss: $41 million | Owners: Marc Lore, Alex Rodriguez
#29. $3.55 billion
One-Year Change: 16% | Revenue: $302 million | Operating Income: $78 million | Owner: Gayle Benson
#30. $3.5 billion
One-Year Change: 17% | Revenue: $306 million | Operating Income: $28 million | Owner: Robert Pera
METHODOLOGY
Revenue and operating income (earnings before interest, taxes, depreciation and amortization) are estimated for the 2024-25 regular season and are net of revenue sharing and arena debt service. Playoff revenue is excluded.
Team values are enterprise values (equity plus net debt) and include the economics of the team’s arena (including non-NBA revenue that accrues to the team’s owner) but not the value of the arena real estate itself. Team values also exclude other related businesses with separate financial statements, such as ancillary real estate developments or team-owned regional sports networks.
Team values are rounded to the nearest $25 million, and estimated revenue and operating income are rounded to the nearest $1 million. All figures are in U.S. dollars based on the average U.S.-Canada exchange rate during the 2024-25 season (1 CAD = 0.73 USD).
The information used to compile the valuations primarily came from interviews with teams, sports bankers and media consultants, as well as public documents, such as arena lease agreements and bond documents.